Hey there mi amigos. Hope you all are having a great thanksgiving break and trying to reset back to work/study. Is it just me or every time a holiday gets over, I get overly tensed about all the things I need to catch up on? The grad life did hit me like a wrecking ball in the past few weeks (relatively speaking) and there’s more to come in the next few weeks with finals coming up. Anyways I think I have ranted enough. So, like my good friends and colleagues have taught me, I am going to believe that this too shall pass and bear fruit.
Financial Statement Fraud (FS Fraud)
In today’s dose of fraud analytics, I am going to talk about an important aspect of financial fraud which has been continuously increasing year on year globally: Financial Statement Fraud. The market for analyzing FS Fraud is expected to grow at 18.3% annually by the end of 2027 which is a cause of great concern.
To simply state what financial statement fraud is for all the non-finance peeps out there, every company releases its financial performance in each quarter indicating the revenue/ profits/ income/ debt etc. that it generated during the quarter. A significant portion of investors rely on these performance indicators to decide whether to invest or divest in the company. When these performance indicators are misrepresented i.e., the company claims to have executed more sales than actual/ or incurred more profit than actual which cannot be explained rationally, it is quite possible that the company has committed financial statement fraud.
Framing the scope of analysis
Naturally, the next question comes, how do we identify this misrepresentation? There are specific analysis steps that a fraud examiner takes to solve this problem. However, it does require comparing a lot of numbers embedded within the financial statements which traditionally are provided on public portals in the form of PDFs. As a forensic analyst, I was often tasked with extracting these numbers on a spreadsheet and analyzing them. Spending 80% of the analysis time on populating the spreadsheet didn’t sound much fun to me and I often wondered if there are smarter ways to automate the extraction of numbers from a PDF.
Moving Towards the Efficient Solution
Enter “Web Crawling“
Selenium and BeautifulSoup have been at the forefront of automation testing and scraping data from websites for about 3-4 years now. In an effort to find financial statement numbers for various listed companies, scrape and obtain insights in a single executable file, I employed Python along with the above-mentioned packages to scrape/extract numbers from a popular fundamental analysis website Screener.in . In brief, the executable python notebook does the following three tasks: –
- Creating a selenium web driver/web crawler: – A web crawler is initialized to execute automated clicks based on a list of ticker symbols of stocks provided within the code. Google Chrome is controlled by this web crawler when the code is executed without any requirement of manual intervention or user clicks.

- Extracting information from each individual type of financial statement: -Basis the CSS selector of the Financial Statement tables (Profit-Loss/ Cash Flow/ Balance Sheet/ Ratios) in each stock’s webpage, relevant numbers are extracted and populated into a data frame. The resulting data frame can be then be downloaded onto excel as a CSV if additional analysis is required.
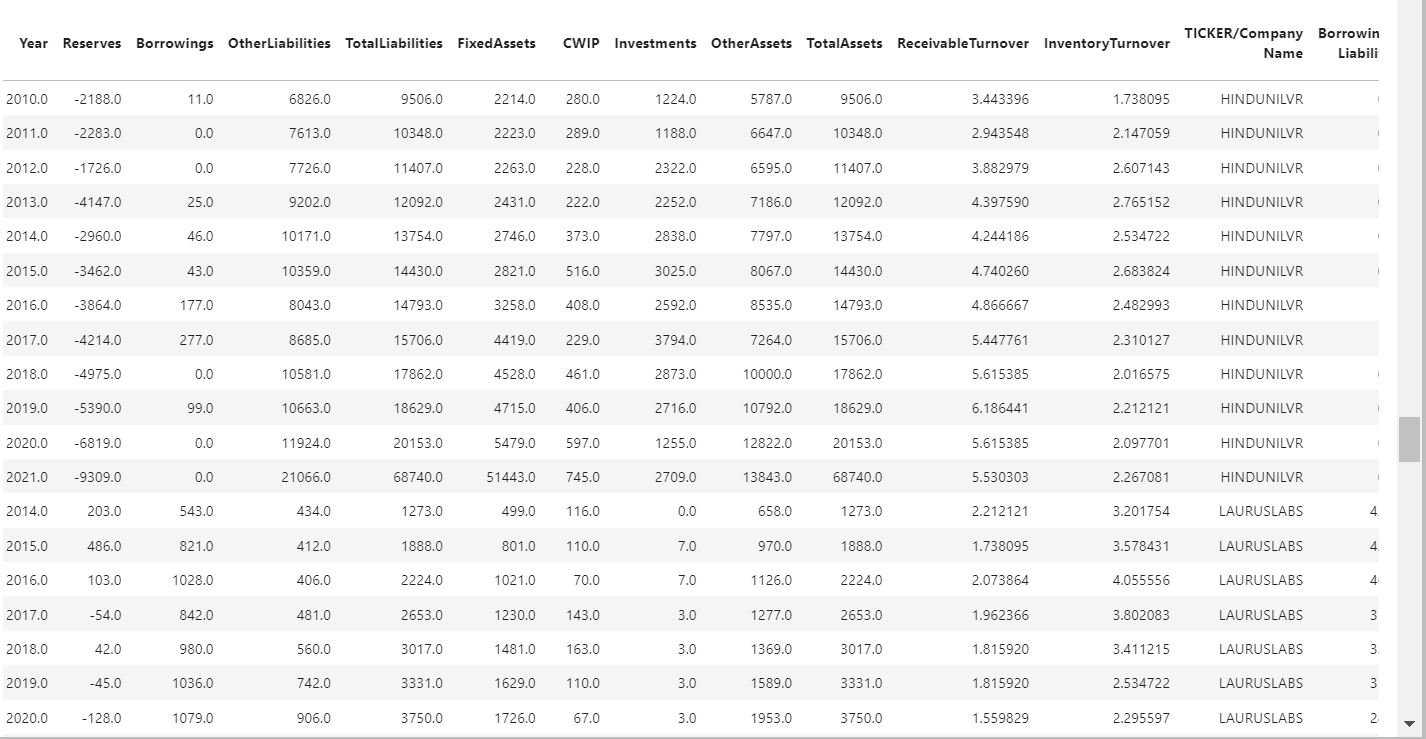

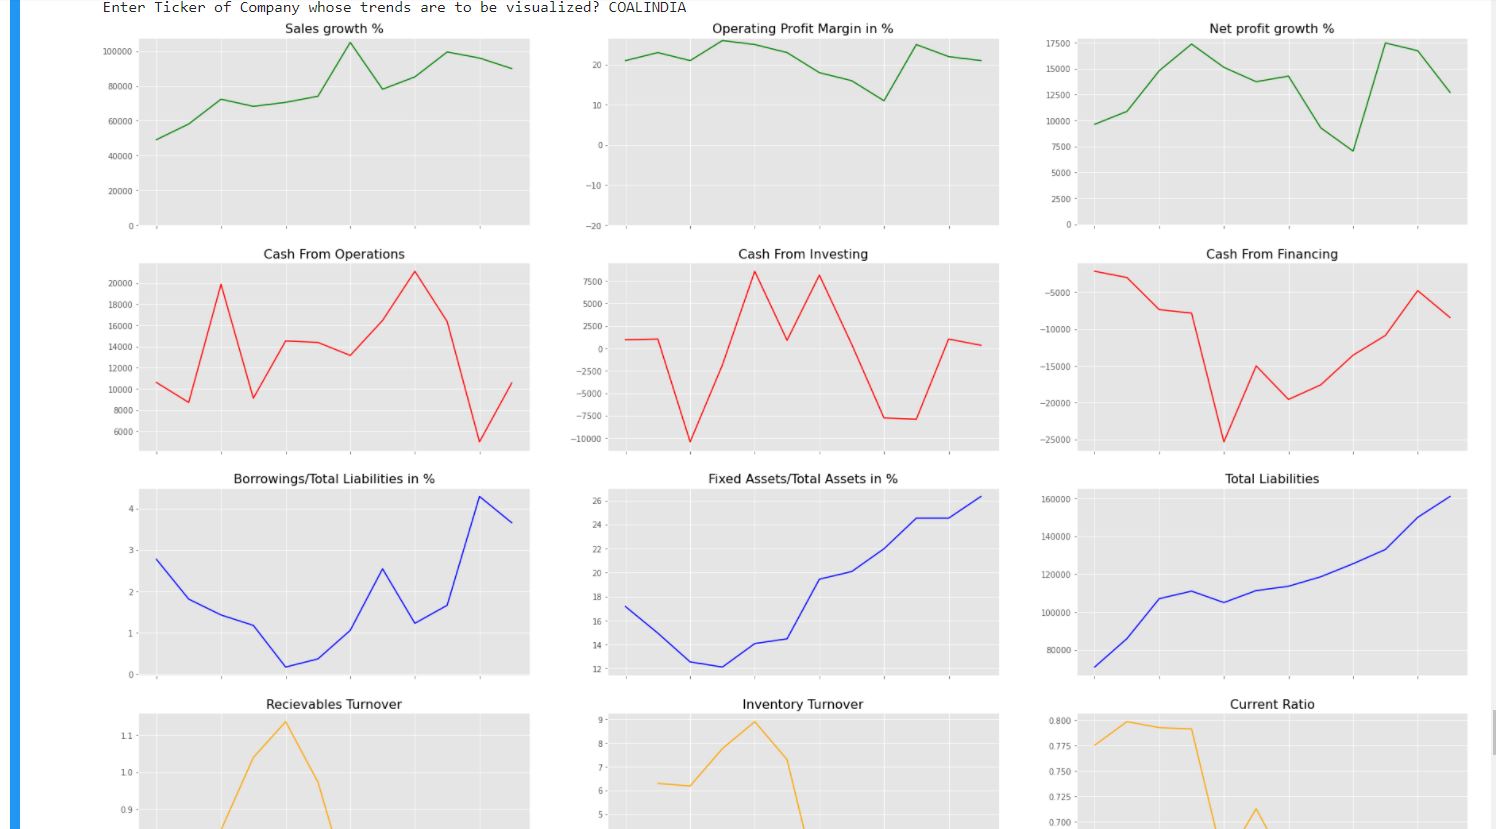
- Visualizing yearly numbers of the created data frame to perform an overall horizontal analysis of financial statements to gain fraud and performance insights.
The complete repository of code along with a sample video of how the crawling works is available here.
Closing Remarks: Identifying what’s wrong and closing investigative leads.
A few parameters from these visualizations that can be assessed for potential fraud could be:-
- Cash Flows not correlated with Profit Margin
- If fraud is committed, net income may be artificially overstated, resulting in a profit margin ratio that is abnormally high compared to other periods. False expenses will cause an increase in expenses and a decrease in the profit margin ratio. Over time this ratio should be fairly consistent.
- Comparing Current Ratio Trends to Liabilities:
- In detecting fraud, this ratio can be a prime indicator of manipulation of accounts involved. Embezzlement will cause the ratio to decrease. Liability concealment will cause a more favorable ratio.
- Comparing Revenue/Sales to Receivables Turnover
- If fictitious sales have been recorded, this bogus income will never be collected. As a result, the turnover of receivables will decrease.
- Comparing Revenue/Sales to Inventory Turnover
- If cost of goods sold has increased due to theft of inventory (ending inventory has
declined, but not through sales), then this ratio will be abnormally high.
- If cost of goods sold has increased due to theft of inventory (ending inventory has
Source: ACFE How to Detect and Prevent Financial Statement Fraud.
The above scenarios could be investigated upon within the results obtained in the python notebook to assess potential fraud that could have occurred. This would lead to shorter turnaround times in identifying potential timeframes to be focused upon, populating and skimming through thousands of numbers by means of efficiently visualizing the changes in the ratios year on year.
